Master Data Analytics &
Launch a High-Demand Career
Learn Data Analytics, Python, SQL, and Visualization tools
with real-world projects and industry guidance
- Hands on Real Projects
- Industry Expert Trainers
- Job & Career Guidance
- Certification Training
About Data Analytics Course
This Data Analytics course is designed to help learners develop the skills required to analyze and interpret complex data. You will learn how to collect, clean, analyze, and visualize data using industry-standard tools. The program focuses on practical training with real-world datasets so that students gain hands-on experience and become job-ready data analysts.

Our Mission
Our Vision
To provide high-quality , hands-on education that transforms beginners into industry ready professionals.
To be a prime institute for innovative tech education and career advancement
Skills you will learn
- Data cleaning & Data preparation
- Data Visualization
- Python & Data Analysis
- SQL for Data Management
- Dash Board Creation
- Business Insights from Data
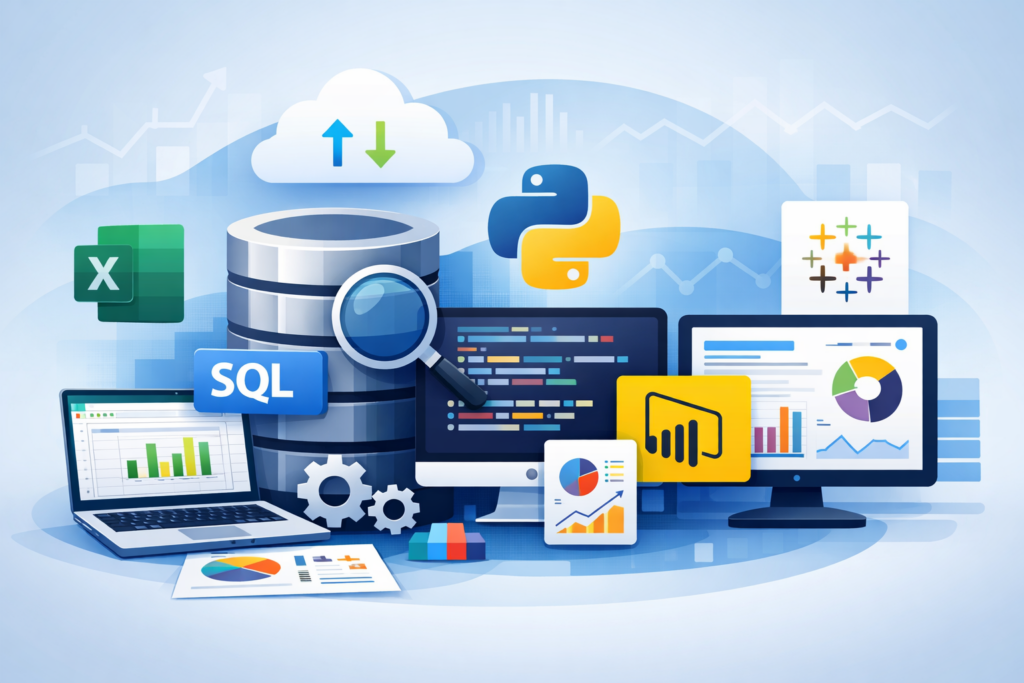
Tools & Technologies covered
In today’s data-driven world, mastering the right tools is essential to become a successful data analyst. This course is designed to provide hands-on experience with industry-standard tools and technologies used by top organizations. From data manipulation and querying to visualization and reporting, you will gain practical knowledge of tools like Excel, SQL, Python, Power BI, and Tableau, enabling you to transform raw data into meaningful insights and make informed business decisions.
Microsoft Excel
Powerful spreadsheet tool used for data cleaning, analysis, and visualization with functions, pivot tables, and charts.
SQL (Structured Query Language)
Used to manage and analyze data stored in databases. Learn how to write queries,
perform joins, and extract meaningful insights.
Python
A versatile programming language widely used in data analytics for automation,
data manipulation, and advanced analysis.
Libraries Covered:
-
Pandas (Data Analysis)
-
NumPy (Numerical Computing)
-
Matplotlib (Data Visualization)
Power BI
Business intelligence tool used to create interactive dashboards and
reports for better decision-making.
Tableau
Advanced data visualization tool that helps transform raw data into easy-to-understand visual insights and dashboards.
Skills you will learn
- Data Cleaning & Preprocessing
- Statistical Analysis
- Data Visualization Techniques
- Dashboard Creation
- Business Insights & Reporting
- Problem-Solving with Data
Course Curriculum
Learn from Basics to Advance with Live Projects
Free Website &Paid Tools
Module 1: Introduction to Data Analytics
- What is Data Analytics
- Types of Data Analytics
- Role of Data Analyst
Module 2: Excel for Data Analysis
- Data Cleaning in Excel
- Pivot Tables & Charts
- Advanced Excel functions
Module 3: SQL for Data Analysis
- Database Basics
- Writing Queries
- Joins,Aggregations and subqueries
Module 4: Python for Data Analytics
- Python Basics
- Data Analysis using Pandas
- Data Visualisation
Module 5: Data Visualization
- Power BI Dashboards
- Tableau Reports
- Storytelling with Data
Who Should Enroll for Data Analyst course ?
Data Analyst | Business Analyst | Reporting Analyst | Data Associate